Report Update: Measuring Construction Activity with AI
March 1, 2020 to May 8, 2020
OxBlue’s artificial intelligence (AI) tools are now being used to measure the effects of the coronavirus (COVID-19) pandemic on construction activity across the United States. The full analysis looked at all 50 states and more than 100 metropolitan areas between March 1st, 2020, and May 8th, 2020.
Increasing Construction Activity Levels
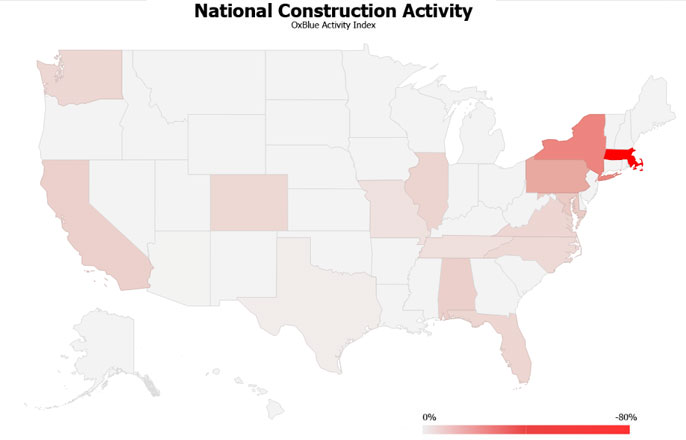
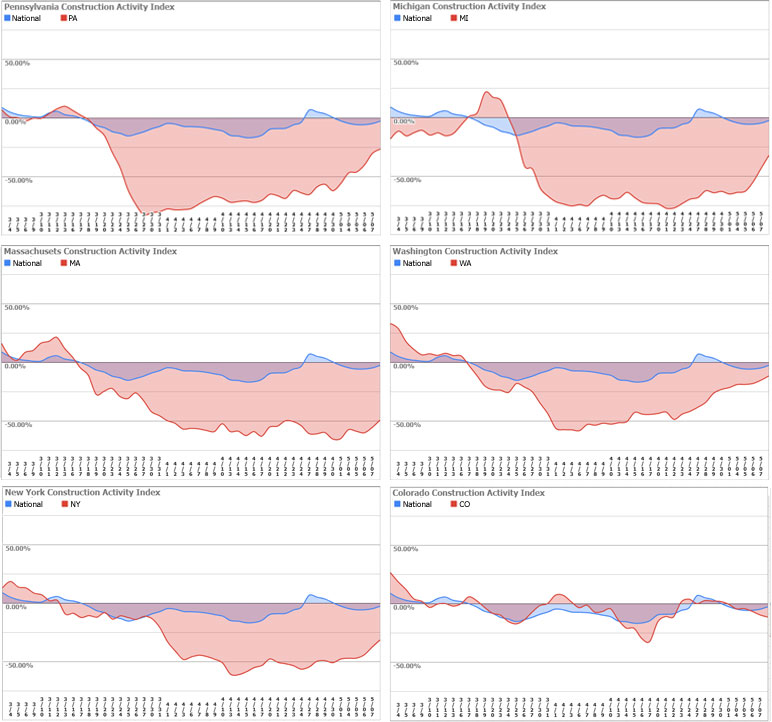
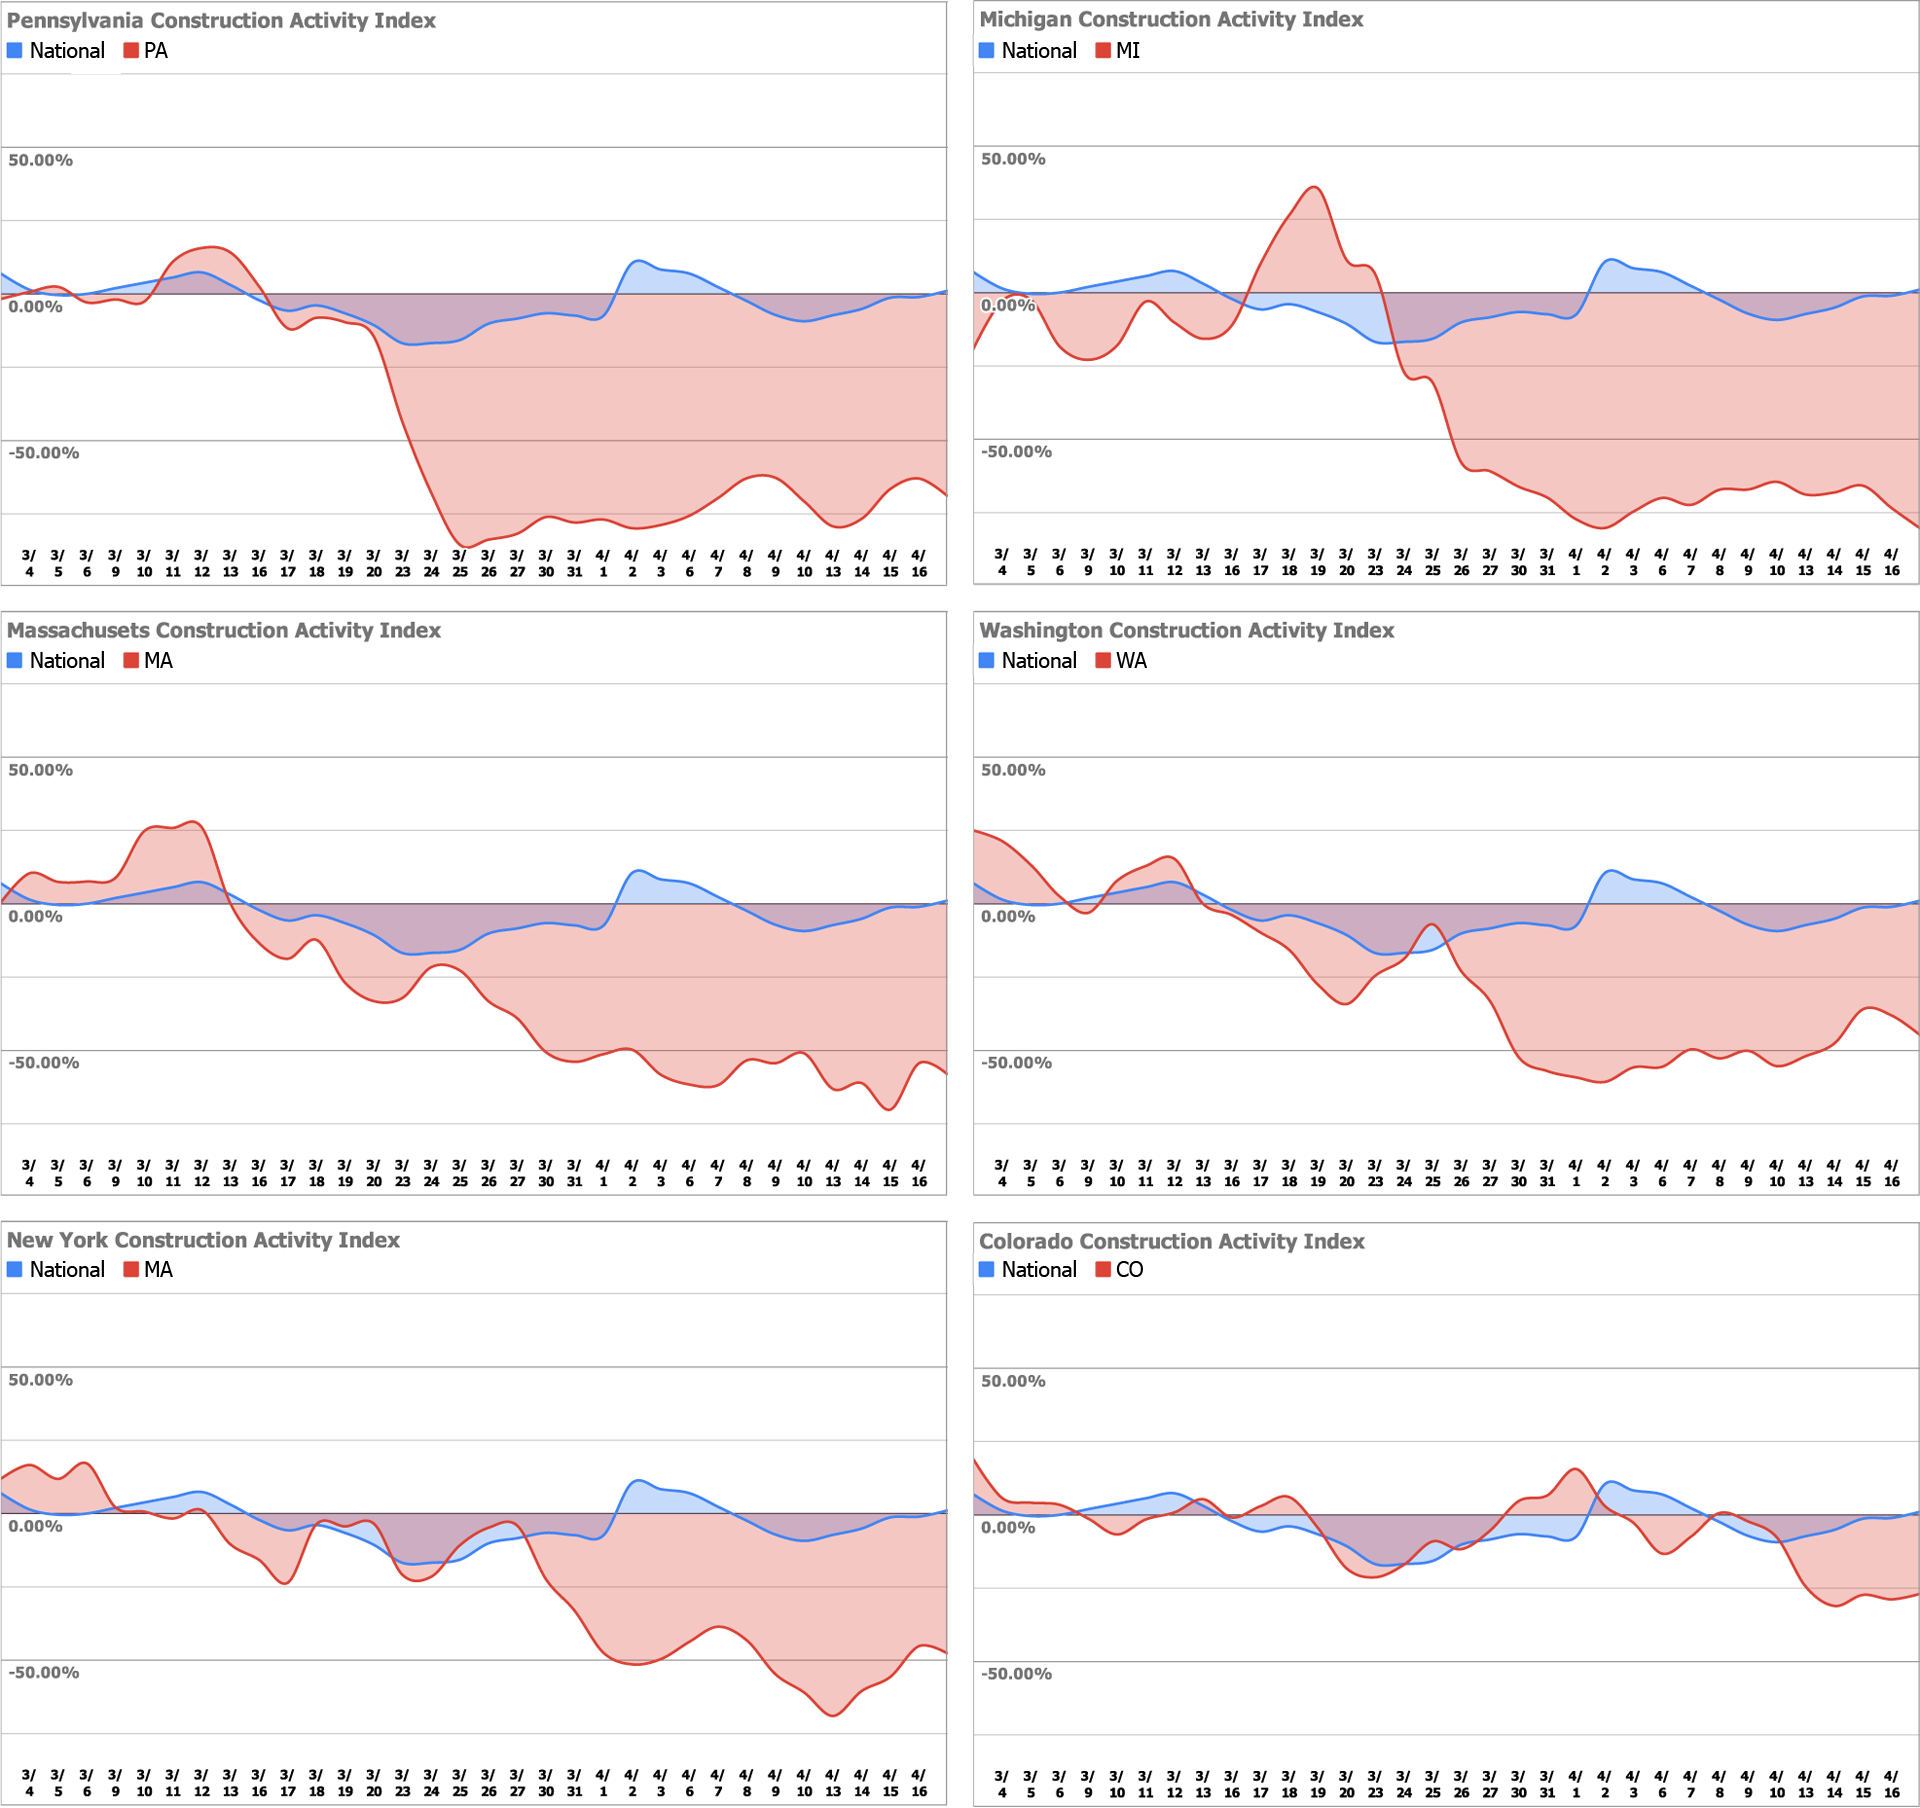
Since our last report, Pennsylvania, Michigan, New York, and Washington are all showing signs of a substantial increase in construction activity. The majority of that increase has occurred during the first week of May 2020. Massachusetts has not seen the level of increase as the other states and the results for Colorado continue to fluctuate.
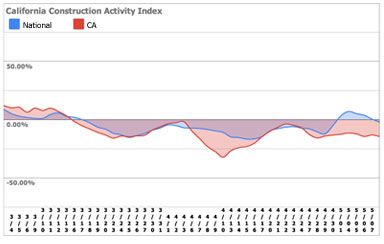
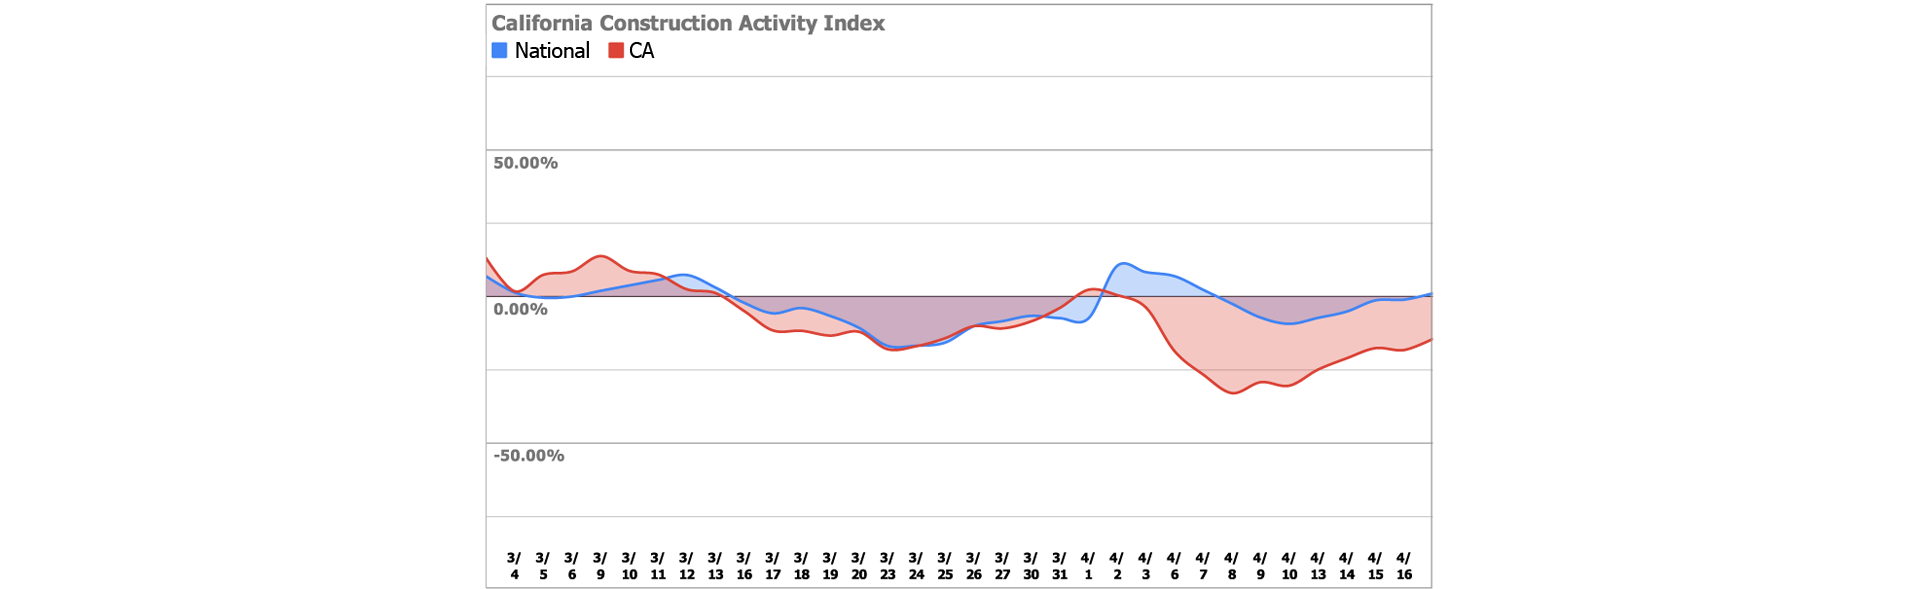
As in previous reports, it’s important to point out California’s activity levels due to its status as the largest economy in the United States. Though the state experienced an increase in late April, activity levels are staying steady at ~13%.
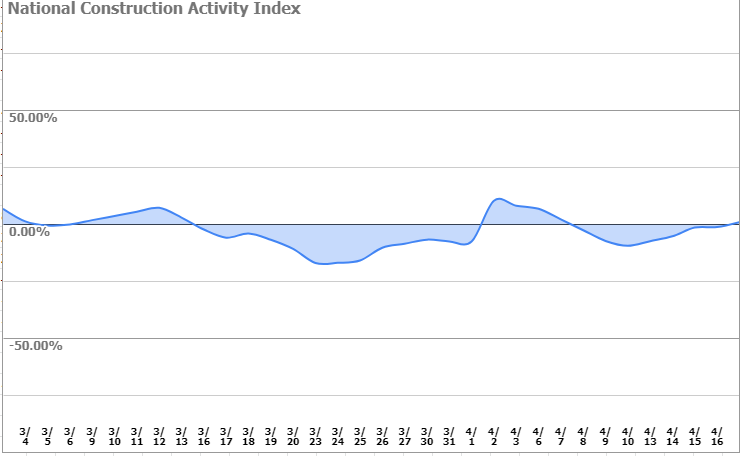
On a national level, construction activity briefly went into the positive percentages at the beginning of May. This is likely due to the rise in activity in Pennsylvania, Michigan, New York, and Washington.
As the crisis continues, OxBlue will share regular updates on how the coronavirus (COVID-19) pandemic is affecting the construction industry and on the technology being developed to combat the spread of the virus.
If you have any questions, please feel free to contact us at (888) 849-2583 or online at oxblue.com/contact.
Notes: The time period in this analysis includes the 50 workdays (weekdays) from March 2, 2020, to May 7, 2020. OxBlue has shifted from a 3-day moving average to a 5-day moving average, similar to what other reports (such as Johns Hopkins’) have been using. The current baseline for the OxBlue Activity Index is the average activity level for the days from March 1st to March 19th, the date Pennsylvania issued its strict shelter-in-place order. The data analyzed is from commercial construction projects and excludes single-family residential construction. States with low levels of construction activity and without statistically significant data have been excluded for accuracy. National construction activity is based on a weighted average of the construction volume for each state.
Report Update: Measuring Construction Activity with AI
March 1, 2020 to April 17, 2020
OxBlue’s artificial intelligence (AI) tools are now being used to measure the effects of the coronavirus (COVID-19) pandemic on construction activity across the United States. The full analysis looked at all 50 states and more than 100 metropolitan areas between March 1st, 2020, and April 17th, 2020.
The Two Realities: State vs. National Activity Levels
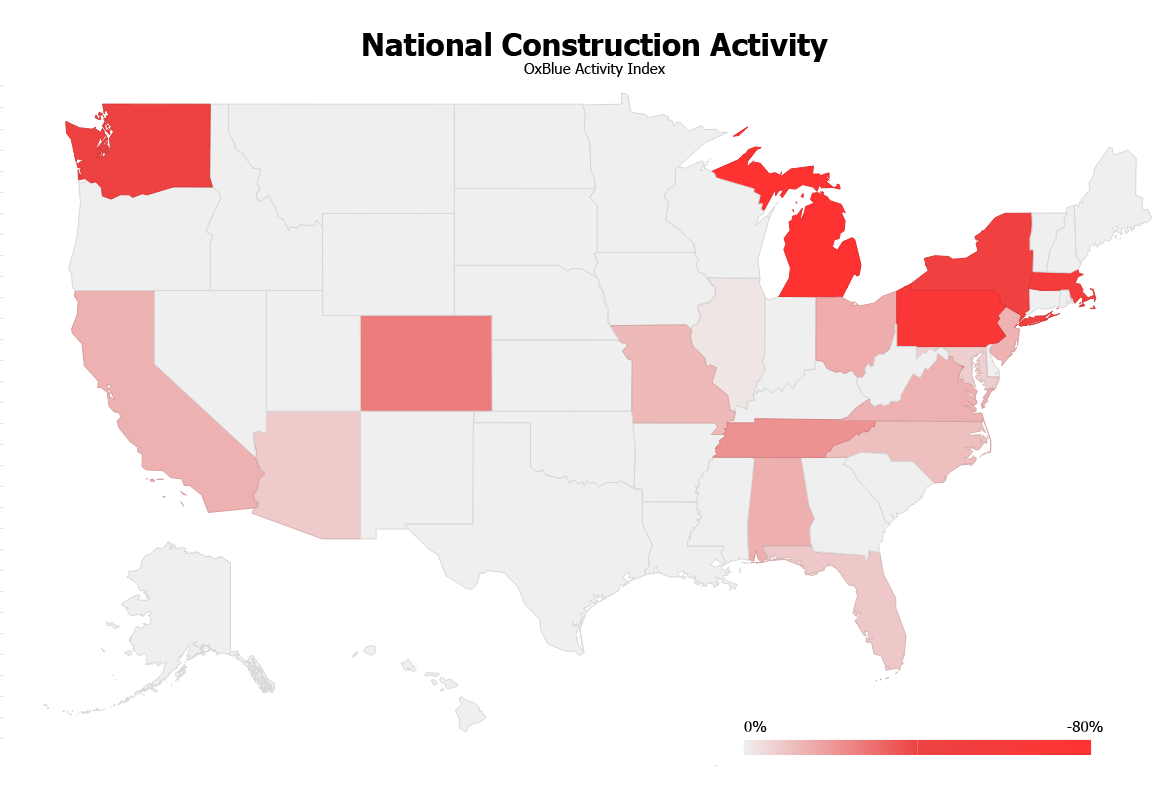
At the state level, construction activity has seen a great deal of change. The number of states with a minimal impact (5% or less) on ongoing construction activity has decreased from 37 to 33 states. The number of states with a general decline in activity (between 5% and 25%) has increased from 7 to 11, and those with the most severe decline in activity (between 25% and 77%) has remained at 6, with Colorado replacing Ohio on the list.
Michigan is the state with the largest decline in activity, with an 81% drop after a stay-at-home order deeming construction non-essential went into effect on March 24th. Pennsylvania, which issued its similar stay-at-home order deeming construction non-essential on March 19th, experienced the second most dramatic drop at approximately 69%. Other states with traditionally high construction volumes experiencing significant change include Massachusetts (58% decline), New York (48% decline), Washington (45% decline), and Colorado (27% decline).
While California did not make the list of states with greater than a 25% decline, its 14% decline is significant due to the state being the largest economy in the U.S. and the fifth-largest in the world.
At a national level, the data is more positive. Construction activity is tracking near the same levels measured for early March 2020. With 60% of the country’s construction concentrated in 10 states and only two of those being hit with more than a 25% decline (NY and PA), the disproportionately high level of construction in those states drives the level of national construction activity. Only six states (Michigan, New Jersey, New York, Pennsylvania, Washington, Vermont) have deemed construction nonessential.
Under normal circumstances, it would be expected to see construction activity increase in spring in some parts of the country, but we see no such increase. It is possible that this has been offset by the pandemic.
As the crisis continues, OxBlue will share regular updates on how the coronavirus (COVID-19) pandemic is affecting the construction industry and on the technology being developed to combat the spread of the virus.
If you have any questions, please feel free to contact us at (888) 849-2583 or online.
Notes: The time period in this analysis includes the 35 workdays (weekdays) from March 2, 2020, to April 17, 2020. The current baseline for the OxBlue Activity Index is the average activity level for the days from March 1st to March 19th, the date Pennsylvania issued its strict shelter-in-place order. The data analyzed is from commercial construction projects and excludes single-family residential construction. States with low levels of construction activity and without statistically significant data have been excluded for accuracy. National construction activity is based on a weighted average of the construction volume for each state.
Analysis of United States Construction Activity using Artificial Intelligence (AI)
March 2020
As the coronavirus (COVID-19) pandemic continues to spread across the United States, the construction industry faces incredible challenges and difficult decisions. Because we’re business owners in the trade ourselves, OxBlue knows the burden this creates. We understand that it’s critical for companies to be able to separate the noise from the facts and make data-driven decisions.
The OxBlue Activity Index, a measure of domestic construction activity, will be updated on a regular basis as this dynamic situation develops. Unlike many macroeconomic indicators that tend to lag, the OxBlue Activity Index is based on near real-time field data, created by measuring job site activity and comparing it to previous milestones. Though the data is pulled from active projects, the data has been anonymized to ensure privacy.
OxBlue utilized its proprietary artificial intelligence (AI) tools and computational resources to measure the effects of the coronavirus (COVID-19) pandemic on construction across the United States. Though previously unannounced, OxBlue’s AI capabilities for measuring construction activity levels had already been validated based on field trials. The tool was originally developed to assist OxBlue clients in understanding construction activity on their projects. As the crisis began to worsen, OxBlue began to analyze data at a national level in order to share timely and actionable data with the construction industry.
The full analysis covered all 50 states and more than 100 metropolitan areas, and it included data from over 150,000 unique images and thousands of unique construction projects. The time period in this analysis includes the 22 workdays (weekdays) during the month of March 2020. The current baseline for the OxBlue Activity Index is the average activity level for the days from March 1st to March 19th, the date Pennsylvania issued its shelter-in-place order. It should be noted that the data analyzed is from commercial construction projects and excludes single-family residential construction.
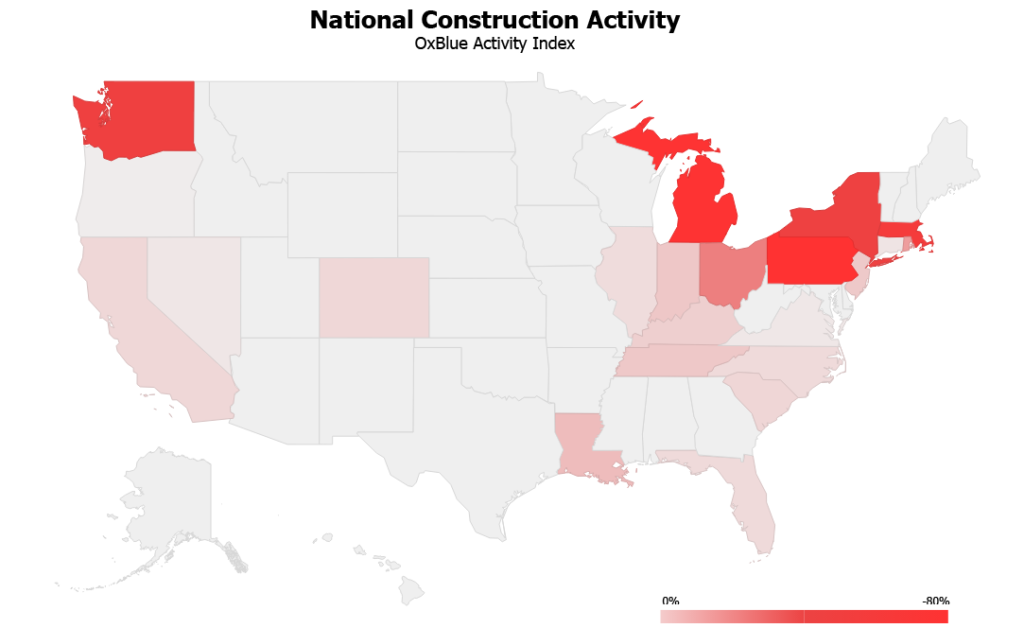
Fig. 1. Indicates the states with the largest decreases in construction activity
The Two Realities
The national level of construction activity (as measured by the OxBlue Activity Index) declined only slightly by approximately 5% in March, based on a weighted average of the construction volume for each state. March construction activity in 37 states either declined by less than 5% or actually increased. In 7 states, the construction activity declined between 5% and 25%. Construction declined more dramatically between 25% and 77% for the remaining 6 states.
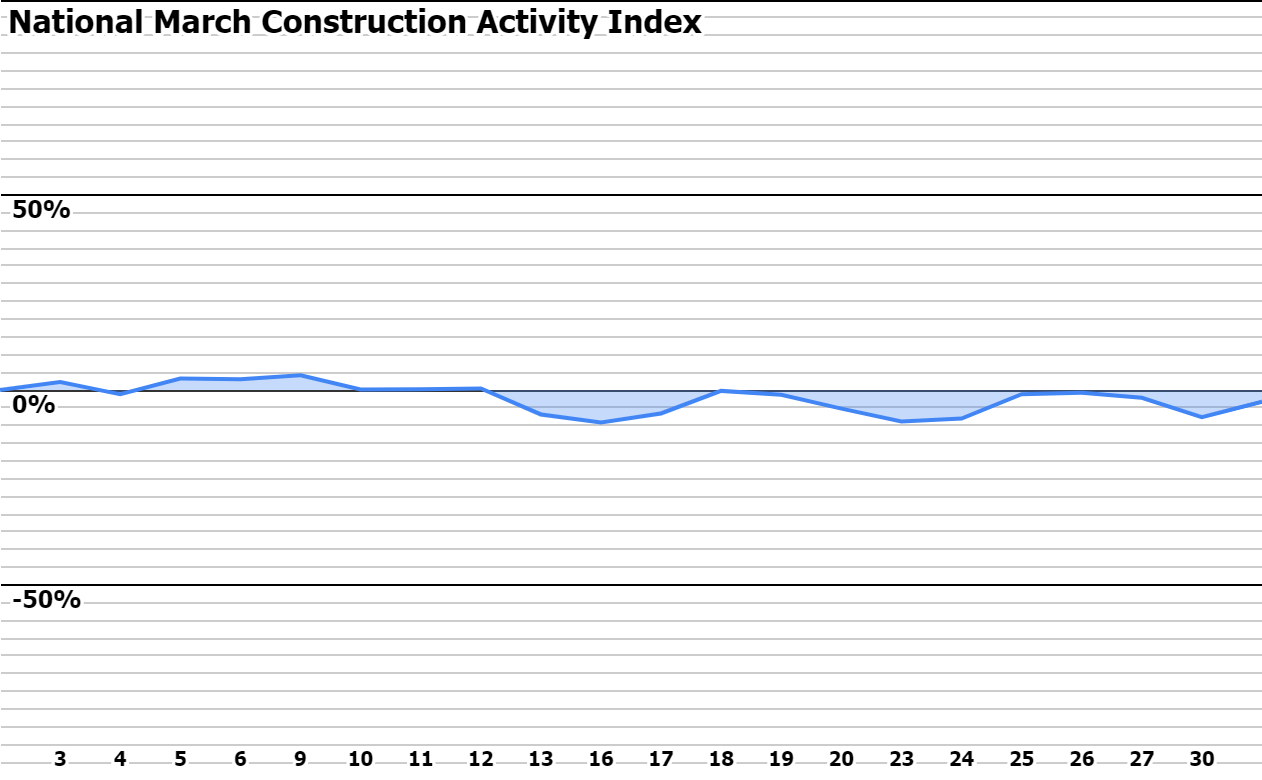
Fig. 2. National March Construction Activity
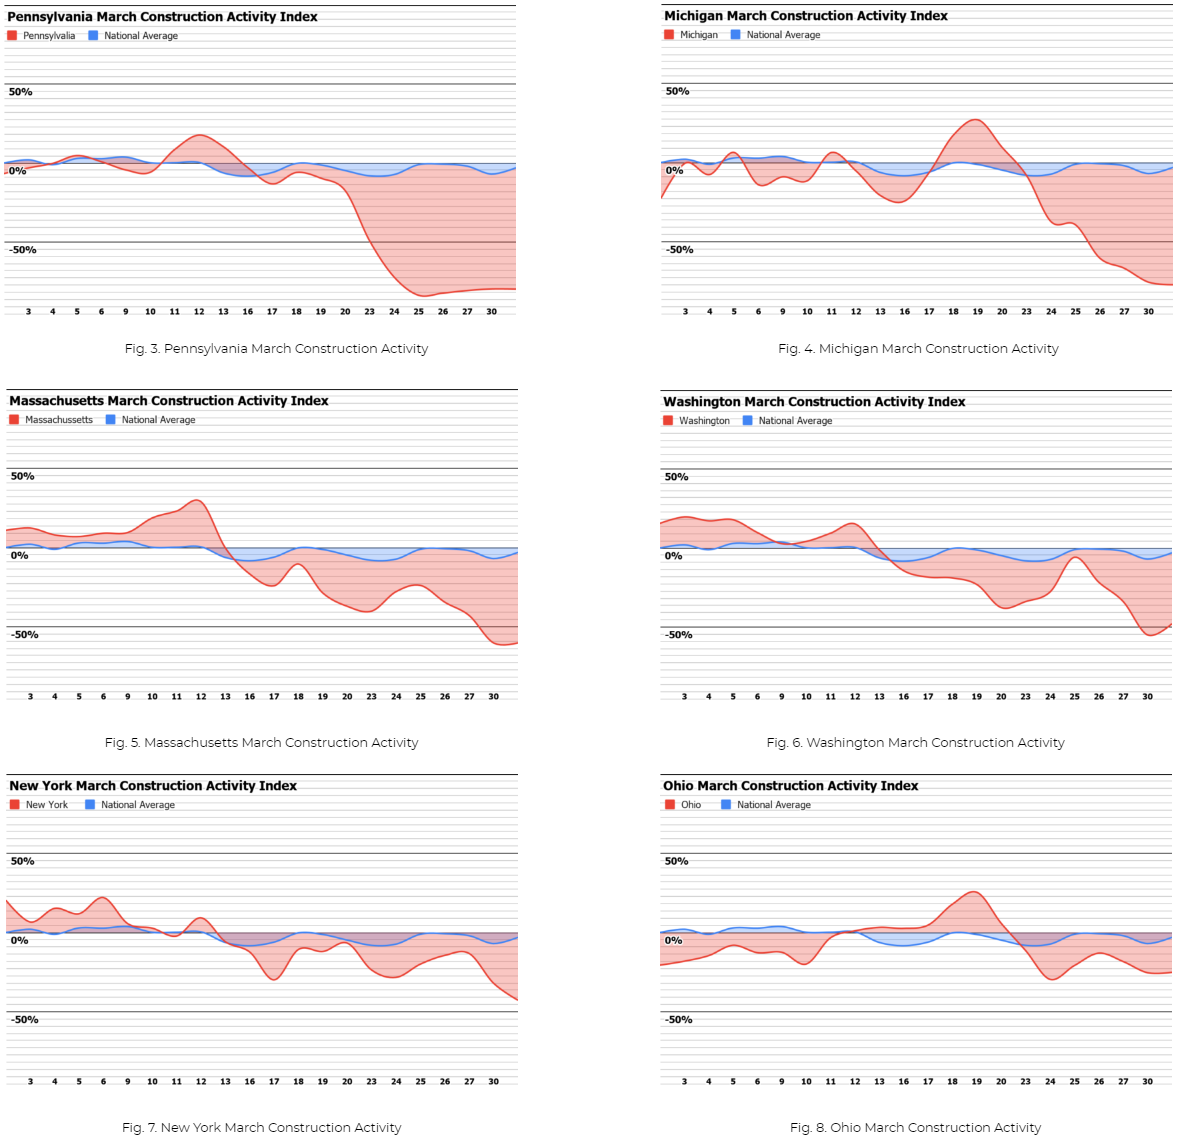
The 6 states with large declines have caused the majority of the national construction decline. Pennsylvania, which issued a stay-at-home order on March 19th that requires the closure of all non-life-sustaining businesses, experienced the most dramatic drop of approximately 77% decline. Michigan has experienced an approximately 74% decline in construction activity after a stay-at-home order on March 23rd. Other states with traditionally high construction volumes experiencing significant change include Massachusetts (57% decline), Washington (45% decline), New York (43% decline) and Ohio (25% decline).
On a regional basis, the most significant change to the OxBlue Activity Index has been an approximately 34% decline in the northeast, relative to the level measured prior to Pennsylvania’s March 19th stay-at-home order.
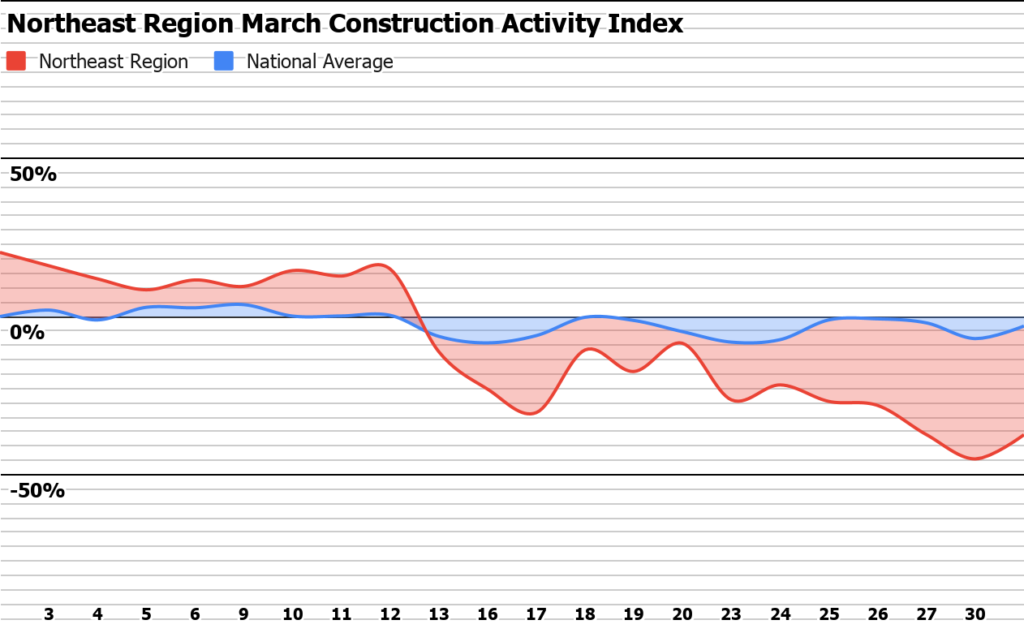
Fig. 9. Northeast Region March Construction Activity
By contrast, 12 states who have not yet issued shelter-in-place orders have seen an increase in construction activity. This is offsetting the declines seen in northeastern states and in metropolitan areas.
Unfortunately, we are still early on in this crisis. We will share regular updates and additional information as data from across the country is accumulated and analyzed.
For more information and resources on how the coronavirus (COVID-19) pandemic is affecting construction, please visit the following:
- Is Construction Essential in Your State (Interactive Map)
- State guidance on construction projects (Interactive Map)
- Latest Updates On The Coronavirus Pandemic (Latest Updates)
If you have any questions, please feel free to contact us at (888) 849-2583 or by sending us a message.